Your SLAs Are Excellent. So Why Are Users Still Frustrated?

Your dashboard says IT is performing well. Your employees keep saying IT is slow. Both can't be right. Or can they? Here's how to uncover the gap between your metrics and your users' experience.
IN THIS ARTICLE
Why strong ticket metrics don't guarantee high satisfaction
Performance metrics vs. experience metrics
Four signs you have a perception gap
Building an experience dashboard
Finding the friction, not just the feedback
Three things to try this week
Every month, your leadership team reviews the same numbers. Average resolution time is down. SLA compliance is above target. The backlog is manageable. By every operational measure, your team is performing well.
Then someone says, "I've been hearing a lot of complaints about IT lately." Another leader adds, "My department feels like tickets disappear into a black hole." Suddenly the conversation moves away from the metrics you've spent months improving.
If that sounds familiar, you're not alone. Many IT managers discover a gap between how their team performs and how end users experience it. Closing tickets fast matters, but users don't judge support by how quickly a ticket reaches "Resolved." They remember how long it took to hear from someone, whether they understood what was happening, and whether it felt like someone owned their problem.
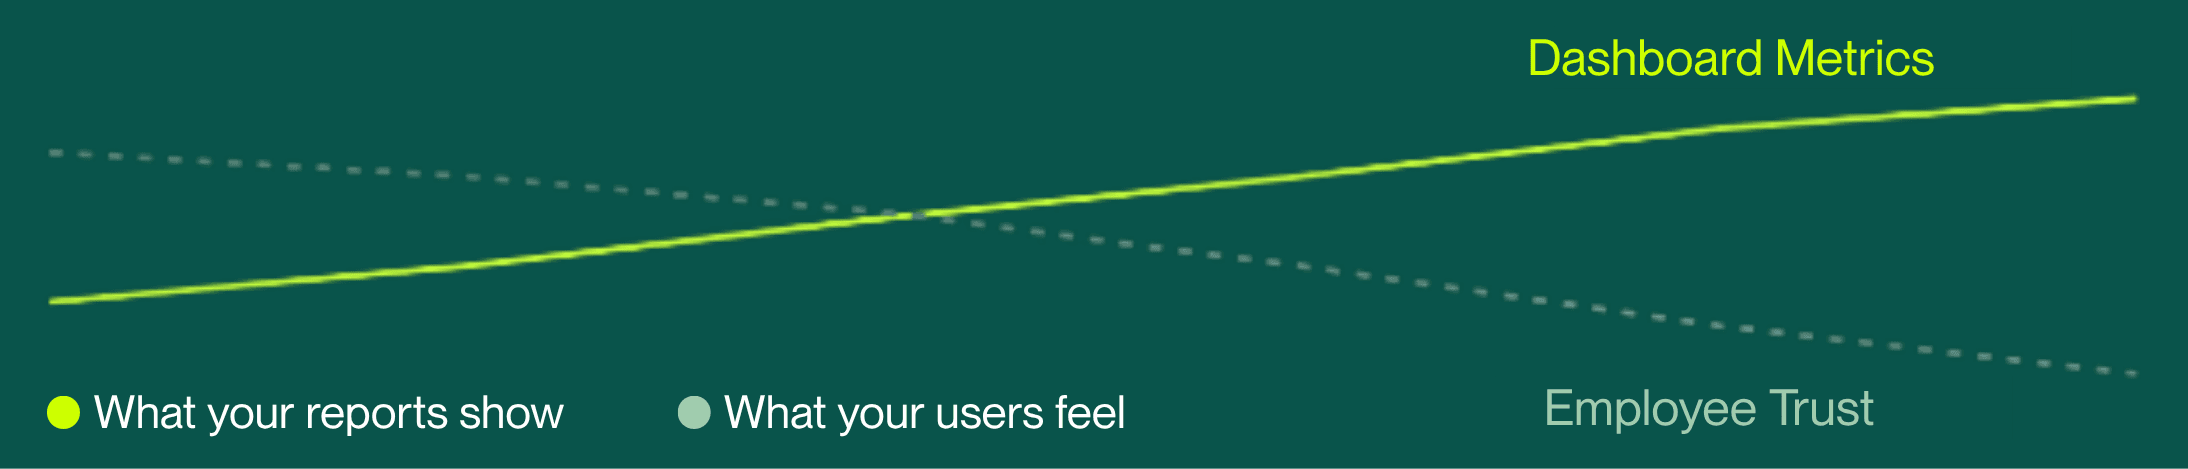
That disconnect is what we'll call the perception gap: the numbers say IT is improving while employee confidence keeps sliding. The good news? Like any operational issue, it's measurable and fixable.
The metrics you track aren't the whole story
Operational metrics matter. You should absolutely know your average resolution time, backlog size, SLA compliance, and ticket volume. They tell you how efficiently your team is running. What they don't tell you is how it felt to be on the other end of the ticket.
Picture two support requests handled in the exact same amount of time.
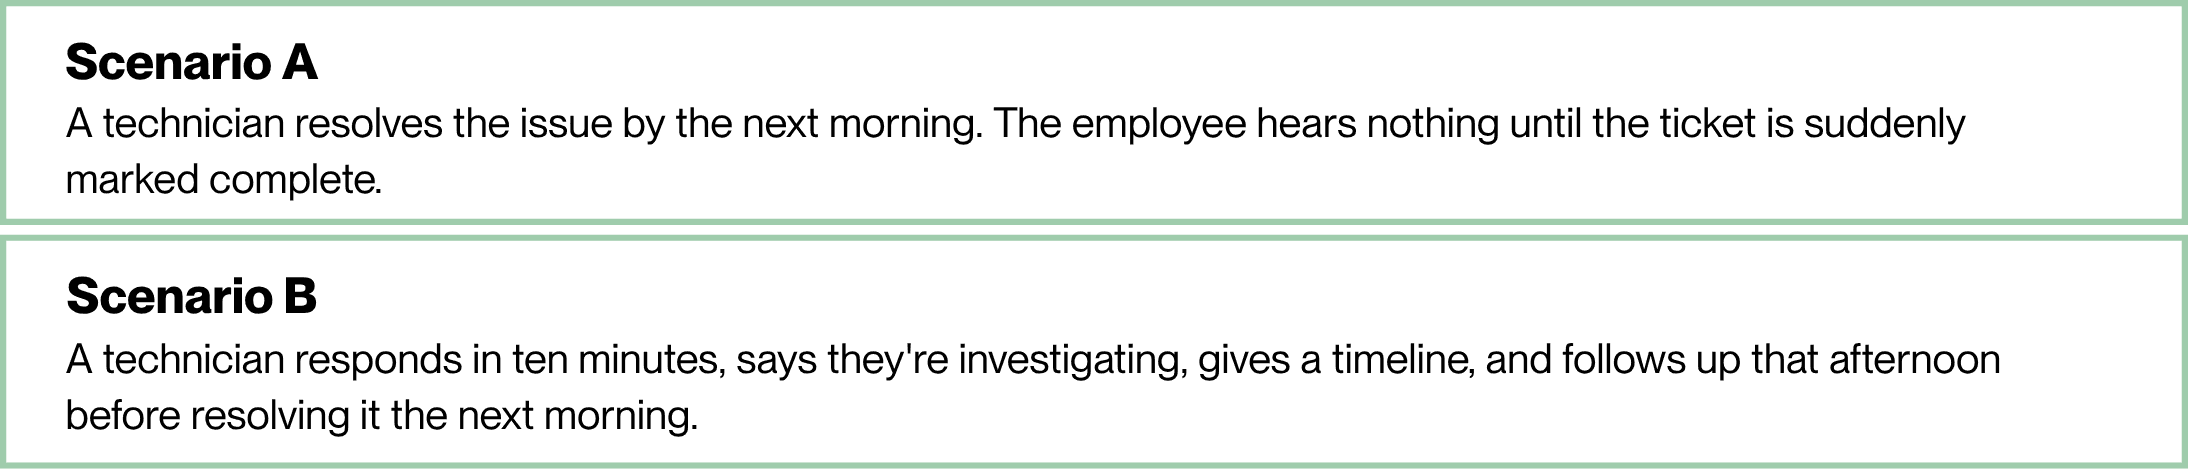
From a dashboard's point of view, those two tickets are nearly identical. From the employee's point of view, they're completely different experiences; one builds confidence, the other creates uncertainty. And uncertainty tends to feel like inactivity, even when a technician is actively working behind the scenes. Improving IT user satisfaction often starts with measuring different things.
"What experience is our reporting hiding?" is a more useful question than "Are we meeting our targets?"
Your dashboard might be lying to you
A report might show your average first response time at 28 minutes. What it doesn't show is the employee who waited three hours because a ticket was misrouted, or the one who got an automated confirmation and then silence until resolution. Your dashboard reports the average. Your users remember the exception.
The fix isn't defending the metrics. It's pairing them with indicators that reveal the experience underneath: first meaningful response, communication frequency, reopen rate, and the themes hiding in your CSAT comments.
Four signs you have a perception gap
The perception gap rarely shows up overnight. It builds through small moments that slowly erode trust.
Your reports show improvement; end user feedback doesn't. Treat recurring complaints as a data source in their own right. If leadership keeps hearing the same concern, your dashboards probably aren't capturing it. | FIX |
"Has anyone looked at my ticket?" is usually a different question in disguise: "Does anyone own this?" Frequent status checks usually mean no one's confirmed ownership yet. | FIX Set a default check-in window (see the cadence table below) and assign a named owner to every ticket within the first hour, even if work hasn't started. A name attached to a ticket stops most "is anyone there?" follow-ups before they happen. |
If a single team consistently expresses dissatisfaction while others don't, look past ticket volume. Do they get fewer updates? Longer waits before first contact? More complex issues? Patterns let you coach the process instead of reacting to isolated complaints. | FIX Review the last 15 tickets from that department and compare them to one with higher satisfaction. The difference usually shows up in communication or response timing, not technician skill. |
A score alone rarely tells the full story. Read the comments; employees often praise the technician while criticizing the process, or note that the wait was long but the communication made it bearable. Those comments are coaching opportunities a number can't give you. | FIX Tag every comment with one theme (communication, speed, professionalism, technical quality) in a shared spreadsheet. After 20-30 tickets, the dominant theme tells you exactly where to spend your next coaching conversation. |
RELATED READING: Stop Starting Every Incident From Zero
Build an experience dashboard
Many small IT teams assume measuring experience requires expensive software. It doesn't. You can build a useful view using information you're likely already collecting.
METRIC | WHAT IT TELLS YOU |
First meaningful response | Not an automated confirmation; how fast a technician sends a real update that acknowledges the issue and sets expectations. |
Communication frequency | How often users hear something while work is in progress. Even a short message signals the issue is still active. |
Ticket reopen rate | A reopened ticket may mean the original fix was incomplete or expectations weren't clear. Industry benchmarks put the average reopen rate around 5.4%. |
CSAT themes | Categorize comments by communication, professionalism, technical quality, or responsiveness rather than scoring alone; patterns point to coaching opportunities. |
Repeat requests | Do the same users or teams come back with similar issues? That can flag a training gap, a documentation gap, or a recurring technical problem. |
Together, these metrics explain why users feel the way they do, not just how efficiently tickets move through your queue.
Set a cadence, not just a vibe
"Communicate more" is advice. A communication cadence is a process. Tie your check-ins to ticket priority so technicians never have to guess when it's time to update a user.
PRIORITY | FIRST MEANINGFUL RESPONSE | UPDATE FREQUENCY |
Critical (outage, blocked work) | Within 15 minutes | Every 60 minutes until resolved |
High (single user blocked) | Within 30 minutes | Every 4 hours |
Standard request | Within 2 hours | Once daily, or at resolution if same-day |
Then give technicians the actual words, so the standard doesn't depend on who's on shift:
ACKNOWLEDGING A NEW TICKET "Hi [name], I've got your ticket and I'm starting on it now. I'll update you by [time] either way, even if it's just to say I'm still working on it." |
EXPLAINING A DELAY "Quick update: this is taking longer than expected because [reason]. Next step is [action], and I expect to have it resolved by [time]." |
CLOSING THE LOOP "This should be fixed now. Here's what was wrong: [plain-language explanation]. Reply here if it happens again and it'll come straight back to me." |
None of this requires new software or another headcount line in next year's budget. It requires a standard, written down, that every technician applies the same way. That is exactly the kind of change a two-to-ten-person team can roll out in a single team meeting.
RELATED READING: What You Do Matters. When You Do It Matters More.
Find the friction, not just the feedback
When an employee says, "IT is slow," it's tempting to hear that as feedback about speed. More often, it's feedback about friction.
Think about the last time you waited on hold with a company. The wait probably wasn't the frustrating part. The uncertainty was. IT support works the same way.
Instead of asking whether users are satisfied, look for the moments where friction enters the experience and match each one with a process improvement.
IF YOU SEE THIS… | …TRY THIS |
Users ask for updates after ~24 hrs | Add a proactive check-in at hour 20, before they have to ask. |
One ticket type drives most follow-up emails | Add a one-line expected-timeline note to the auto-confirmation for that ticket type. |
A department reopens tickets often | Add a "confirm before closing" step for that team instead of auto-closing on fix. |
Users go quiet mid-ticket | Follow up once to confirm resolution; silence isn't always satisfaction. |
Communication breaks down at handoff | Require a one-line handoff note any time a ticket changes owners. |
Those pairings are often more useful than an average CSAT score because each one points to a specific, fixable process. If password resets score well while software installs generate complaints, compare the two workflows directly; the gap is usually about expectation-setting, not technical difficulty.
The goal isn't to eliminate every point of friction, that's unrealistic. It's to find the friction you can control and build a process that removes the uncertainty before it becomes frustration.
What this means for small IT teams
For managers leading two to ten technicians, every interaction matters. You don't have the luxury of hiding behind volume. Employees notice quickly when communication is inconsistent, and just as quickly when a technician takes ownership. That's your advantage. One communication standard can improve every support interaction by the end of the week. That consistency is what builds trust and turns IT from "the people who fix computers" into a true business partner.
RELATED READING: The IT Night Shift You Already Have
DO THIS TODAY
The one-hour coverage audit
You don't need a new platform to start closing the perception gap. You need an hour and your last month of tickets.
Pull your last ten CSAT comments.
Ignore the scores. Look for repeated themes in what employees praise or criticize.Measure first meaningful response time.
How long until a user gets a real, personalized update, not an auto-reply? That number may matter more than overall resolution time.Set one communication standard.
Decide when technicians should proactively update users, and hold the line on it. Consistency beats perfection.
The next time someone says "IT feels slow," resist the urge to open your ticket dashboard first.
Fast resolutions matter. So does making employees feel informed while they wait.
Teams that measure both operational performance and customer experience earn something that's harder to quantify than SLA compliance: trust.

About the Author

Michelle Burnham has worked in and around the technology industry for nearly a decade; collaborating with IT support teams and contributing to technical documentation, service-oriented content, and operational communications. With a background in editing, formatting, and visual design, she specializes in translating complex ideas into clear, engaging content. In addition to her freelance creative work, she serves as a contract graphic designer, copywriter, and video editor for Helpt.
Your dashboard says IT is performing well. Your employees keep saying IT is slow. Both can't be right. Or can they? Here's how to uncover the gap between your metrics and your users' experience.
IN THIS ARTICLE
Why strong ticket metrics don't guarantee high satisfaction
Performance metrics vs. experience metrics
Four signs you have a perception gap
Building an experience dashboard
Finding the friction, not just the feedback
Three things to try this week
Every month, your leadership team reviews the same numbers. Average resolution time is down. SLA compliance is above target. The backlog is manageable. By every operational measure, your team is performing well.
Then someone says, "I've been hearing a lot of complaints about IT lately." Another leader adds, "My department feels like tickets disappear into a black hole." Suddenly the conversation moves away from the metrics you've spent months improving.
If that sounds familiar, you're not alone. Many IT managers discover a gap between how their team performs and how end users experience it. Closing tickets fast matters, but users don't judge support by how quickly a ticket reaches "Resolved." They remember how long it took to hear from someone, whether they understood what was happening, and whether it felt like someone owned their problem.
That disconnect is what we'll call the perception gap: the numbers say IT is improving while employee confidence keeps sliding. The good news? Like any operational issue, it's measurable and fixable.
The metrics you track aren't the whole story
Operational metrics matter. You should absolutely know your average resolution time, backlog size, SLA compliance, and ticket volume. They tell you how efficiently your team is running. What they don't tell you is how it felt to be on the other end of the ticket.
Picture two support requests handled in the exact same amount of time.
From a dashboard's point of view, those two tickets are nearly identical. From the employee's point of view, they're completely different experiences; one builds confidence, the other creates uncertainty. And uncertainty tends to feel like inactivity, even when a technician is actively working behind the scenes. Improving IT user satisfaction often starts with measuring different things.
"What experience is our reporting hiding?" is a more useful question than "Are we meeting our targets?"
Your dashboard might be lying to you
A report might show your average first response time at 28 minutes. What it doesn't show is the employee who waited three hours because a ticket was misrouted, or the one who got an automated confirmation and then silence until resolution. Your dashboard reports the average. Your users remember the exception.
The fix isn't defending the metrics. It's pairing them with indicators that reveal the experience underneath: first meaningful response, communication frequency, reopen rate, and the themes hiding in your CSAT comments.
Four signs you have a perception gap
The perception gap rarely shows up overnight. It builds through small moments that slowly erode trust.
Your reports show improvement; end user feedback doesn't. Treat recurring complaints as a data source in their own right. If leadership keeps hearing the same concern, your dashboards probably aren't capturing it. | FIX |
"Has anyone looked at my ticket?" is usually a different question in disguise: "Does anyone own this?" Frequent status checks usually mean no one's confirmed ownership yet. | FIX Set a default check-in window (see the cadence table below) and assign a named owner to every ticket within the first hour, even if work hasn't started. A name attached to a ticket stops most "is anyone there?" follow-ups before they happen. |
If a single team consistently expresses dissatisfaction while others don't, look past ticket volume. Do they get fewer updates? Longer waits before first contact? More complex issues? Patterns let you coach the process instead of reacting to isolated complaints. | FIX Review the last 15 tickets from that department and compare them to one with higher satisfaction. The difference usually shows up in communication or response timing, not technician skill. |
A score alone rarely tells the full story. Read the comments; employees often praise the technician while criticizing the process, or note that the wait was long but the communication made it bearable. Those comments are coaching opportunities a number can't give you. | FIX Tag every comment with one theme (communication, speed, professionalism, technical quality) in a shared spreadsheet. After 20-30 tickets, the dominant theme tells you exactly where to spend your next coaching conversation. |
RELATED READING: Stop Starting Every Incident From Zero
Build an experience dashboard
Many small IT teams assume measuring experience requires expensive software. It doesn't. You can build a useful view using information you're likely already collecting.
METRIC | WHAT IT TELLS YOU |
First meaningful response | Not an automated confirmation; how fast a technician sends a real update that acknowledges the issue and sets expectations. |
Communication frequency | How often users hear something while work is in progress. Even a short message signals the issue is still active. |
Ticket reopen rate | A reopened ticket may mean the original fix was incomplete or expectations weren't clear. Industry benchmarks put the average reopen rate around 5.4%. |
CSAT themes | Categorize comments by communication, professionalism, technical quality, or responsiveness rather than scoring alone; patterns point to coaching opportunities. |
Repeat requests | Do the same users or teams come back with similar issues? That can flag a training gap, a documentation gap, or a recurring technical problem. |
Together, these metrics explain why users feel the way they do, not just how efficiently tickets move through your queue.
Set a cadence, not just a vibe
"Communicate more" is advice. A communication cadence is a process. Tie your check-ins to ticket priority so technicians never have to guess when it's time to update a user.
PRIORITY | FIRST MEANINGFUL RESPONSE | UPDATE FREQUENCY |
Critical (outage, blocked work) | Within 15 minutes | Every 60 minutes until resolved |
High (single user blocked) | Within 30 minutes | Every 4 hours |
Standard request | Within 2 hours | Once daily, or at resolution if same-day |
Then give technicians the actual words, so the standard doesn't depend on who's on shift:
ACKNOWLEDGING A NEW TICKET "Hi [name], I've got your ticket and I'm starting on it now. I'll update you by [time] either way, even if it's just to say I'm still working on it." |
EXPLAINING A DELAY "Quick update: this is taking longer than expected because [reason]. Next step is [action], and I expect to have it resolved by [time]." |
CLOSING THE LOOP "This should be fixed now. Here's what was wrong: [plain-language explanation]. Reply here if it happens again and it'll come straight back to me." |
None of this requires new software or another headcount line in next year's budget. It requires a standard, written down, that every technician applies the same way. That is exactly the kind of change a two-to-ten-person team can roll out in a single team meeting.
RELATED READING: What You Do Matters. When You Do It Matters More.
Find the friction, not just the feedback
When an employee says, "IT is slow," it's tempting to hear that as feedback about speed. More often, it's feedback about friction.
Think about the last time you waited on hold with a company. The wait probably wasn't the frustrating part. The uncertainty was. IT support works the same way.
Instead of asking whether users are satisfied, look for the moments where friction enters the experience and match each one with a process improvement.
IF YOU SEE THIS… | …TRY THIS |
Users ask for updates after ~24 hrs | Add a proactive check-in at hour 20, before they have to ask. |
One ticket type drives most follow-up emails | Add a one-line expected-timeline note to the auto-confirmation for that ticket type. |
A department reopens tickets often | Add a "confirm before closing" step for that team instead of auto-closing on fix. |
Users go quiet mid-ticket | Follow up once to confirm resolution; silence isn't always satisfaction. |
Communication breaks down at handoff | Require a one-line handoff note any time a ticket changes owners. |
Those pairings are often more useful than an average CSAT score because each one points to a specific, fixable process. If password resets score well while software installs generate complaints, compare the two workflows directly; the gap is usually about expectation-setting, not technical difficulty.
The goal isn't to eliminate every point of friction, that's unrealistic. It's to find the friction you can control and build a process that removes the uncertainty before it becomes frustration.
What this means for small IT teams
For managers leading two to ten technicians, every interaction matters. You don't have the luxury of hiding behind volume. Employees notice quickly when communication is inconsistent, and just as quickly when a technician takes ownership. That's your advantage. One communication standard can improve every support interaction by the end of the week. That consistency is what builds trust and turns IT from "the people who fix computers" into a true business partner.
RELATED READING: The IT Night Shift You Already Have
DO THIS TODAY
The one-hour coverage audit
You don't need a new platform to start closing the perception gap. You need an hour and your last month of tickets.
Pull your last ten CSAT comments.
Ignore the scores. Look for repeated themes in what employees praise or criticize.Measure first meaningful response time.
How long until a user gets a real, personalized update, not an auto-reply? That number may matter more than overall resolution time.Set one communication standard.
Decide when technicians should proactively update users, and hold the line on it. Consistency beats perfection.
The next time someone says "IT feels slow," resist the urge to open your ticket dashboard first.
Fast resolutions matter. So does making employees feel informed while they wait.
Teams that measure both operational performance and customer experience earn something that's harder to quantify than SLA compliance: trust.
About the Author
Michelle Burnham has worked in and around the technology industry for nearly a decade; collaborating with IT support teams and contributing to technical documentation, service-oriented content, and operational communications. With a background in editing, formatting, and visual design, she specializes in translating complex ideas into clear, engaging content. In addition to her freelance creative work, she serves as a contract graphic designer, copywriter, and video editor for Helpt.
Stop Answering Calls.
Start Driving Growth.
Let Helpt's US-based technicians handle your support calls 24x7 while your team focuses on what matters most.
Stop Answering Calls.
Start Driving Growth.
Let Helpt's US-based technicians handle your support calls 24x7 while your team focuses on what matters most.
Stop Answering Calls.
Start Driving Growth.
Let Helpt's US-based technicians handle your support calls 24x7 while your team focuses on what matters most.
©2026 Helpt, a part of PAG Technology Inc. All Rights Reserved.